Business Central can execute a plan. It has never been able to compute one.
ForecastQ reads your own Item Ledger Entry — no sync, no portal, nothing exported — and turns it into a demand forecast, a safety stock, and a reorder point for every item, at every location, in every variant. Then it writes those numbers into the native fields Business Central's planning engine already reads. Your purchase orders are still created by Calculate Plan, from a worksheet a person still approves.
No portal · no connector · every figure reproducible by hand
Your planning run is silently skipping items today. Most tenants have never checked.
Before ForecastQ writes a single field, its Readiness Auditor reads your item, location and stockkeeping-unit setup and tells you, in plain language, what Calculate Plan is quietly not acting on right now:
- Items with demand and no reorder point — invisible to a shortage check until someone notices the stockout.
- Items blocked for purchasing that are still carrying open forecast demand.
- Multi-location demand with no stockkeeping unit — so any policy that exists can only be company-wide.
It is read-only. It writes nothing. It is usually the fastest way to find out whether this is worth your time.
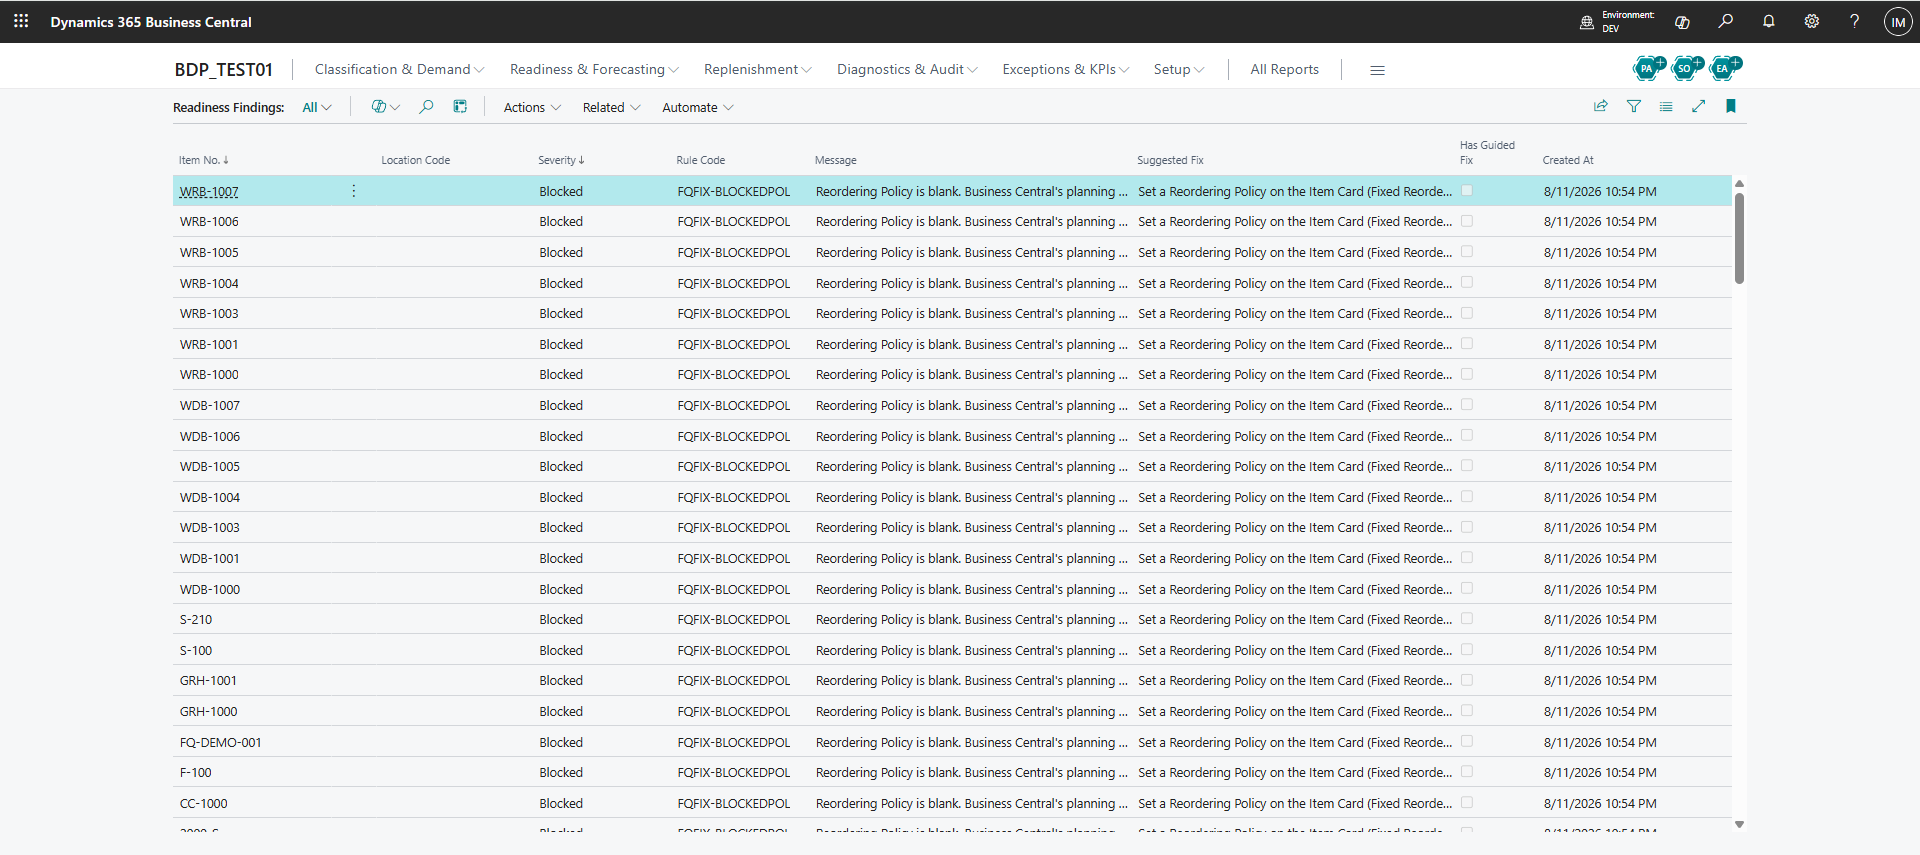
Calculate Plan is quietly not acting on right now, with the rule that caught it, the reason in plain language, and the fix. Read-only; it writes nothing. This is usually the fastest way to find out whether ForecastQ is worth your time. Figures shown are from a test dataset, not a customer portfolio.
Static numbers, in a business that isn't.
Before the how, it's worth being precise about what's actually broken — and where Business Central already gets it right.
Why do safety stock and reorder points go stale?
Safety Stock Quantity, Reorder Point and Reorder Quantity are fields on the Item card and the Stockkeeping Unit. Business Central has had them since day one, and Calculate Plan has always read them. What it has never had is a way to work them out. Someone types a number in — at go-live, on a launch order, as a guess that happened to work — and Business Central keeps reading that same number for as long as nobody changes it.
Demand doesn't hold still for that long. A location's sales pattern shifts, a supplier's lead time drifts, a seasonal item's season moves earlier or later than last year's — and the field on the card is exactly where it was the day someone last touched it, which is often longer ago than anyone currently on the team would guess.
What does Business Central do natively, and where does it stop?
Calculate Plan is the part of this worth trusting without qualification: it nets demand against supply, respects a reorder point once one exists, and proposes purchase and transfer lines correctly and natively. That isn't a caveat on the way to a pitch — it's a design principle ForecastQ holds on purpose, covered in full further down this page.
What Business Central's own native surfaces don't do is compute those three fields from your demand history — Microsoft's own design documentation is explicit that they're typed in, not derived. A forecast extension ships free with every Business Central subscription, and it's a genuinely useful tool for what it does: one number per item, blended across every location, because that's how it's built. Free, native tools that write those same three fields from a forecast exist too, for a single user. So writing the fields isn't the rare part. Being able to say why the number is what it is — that's the part covered below.
When should these be computed rather than typed?
A few questions worth answering honestly, before anything else:
- Do you plan more than one location, and does each one see different demand?
- Is the catalogue larger than one planner can review line by line, in a normal week?
- Has a lead time moved since the number in that field was last touched?
- Could you say, right now, out loud, why a specific item's reorder point is what it is?
How are the numbers produced?
ForecastQ reads Item Ledger Entry directly — the same table Business Central posts every sale and consumption into — with no export, sync or staging step in between. From that history it classifies each item by value and by volatility, then forecasts it with a panel of classical statistical methods, selected per item by back-test rather than one model applied everywhere. From the forecast it derives a safety stock and reorder point sized to how erratic the item actually is, and a lead time measured from your own posted receipts rather than assumed. The full mechanism, worked as arithmetic you can check by hand, is further down this page.
What happens when there isn't enough history?
A forecast fitted to one or two data points isn't cautious — it's just confident about very little. A method that has to produce a number will produce one regardless, and a number with no visible uncertainty around it is easy to mistake for a fact. ForecastQ treats "not enough history yet" as its own state instead of quietly guessing: an item with too little history is marked Insufficient Data, visibly, rather than scored as if it were as predictable as an item with three years behind it.
When a new part number replaces a discontinued one, that gap can be closed honestly too — a planner can link the two, and the successor inherits the predecessor's demand history rather than starting from nothing (more on that further down this page).
How would you know if it were wrong?
Ask that of most forecasting tools and the honest answer is: you wouldn't, until the stockout or the writeoff told you. ForecastQ back-tests every method against your own history before it's allowed to run, reports the resulting accuracy and bias per item — not as a single company-wide score — and won't let a method win by luck: if it can't out-perform a plain Baseline forecast on your own data, the Baseline ships instead, visibly. The same inputs always produce the same numbers, run once or run again.
None of that is a promise that a forecast will be right. It's a way of finding out, quickly, when it wasn't — which is the actual question worth asking before you trust any number enough to stop typing it in yourself.
Five stages. Each one reads what the last one wrote.
Nothing here is a black box you have to trust. Every stage produces a number you can trace back to the ledger rows that made it, and the arithmetic is textbook statistics, not a proprietary score.
Ledger → demand buckets
Sale and Consumption entries become signed monthly demand per item × location × variant. A return reduces demand instead of pretending it never happened.
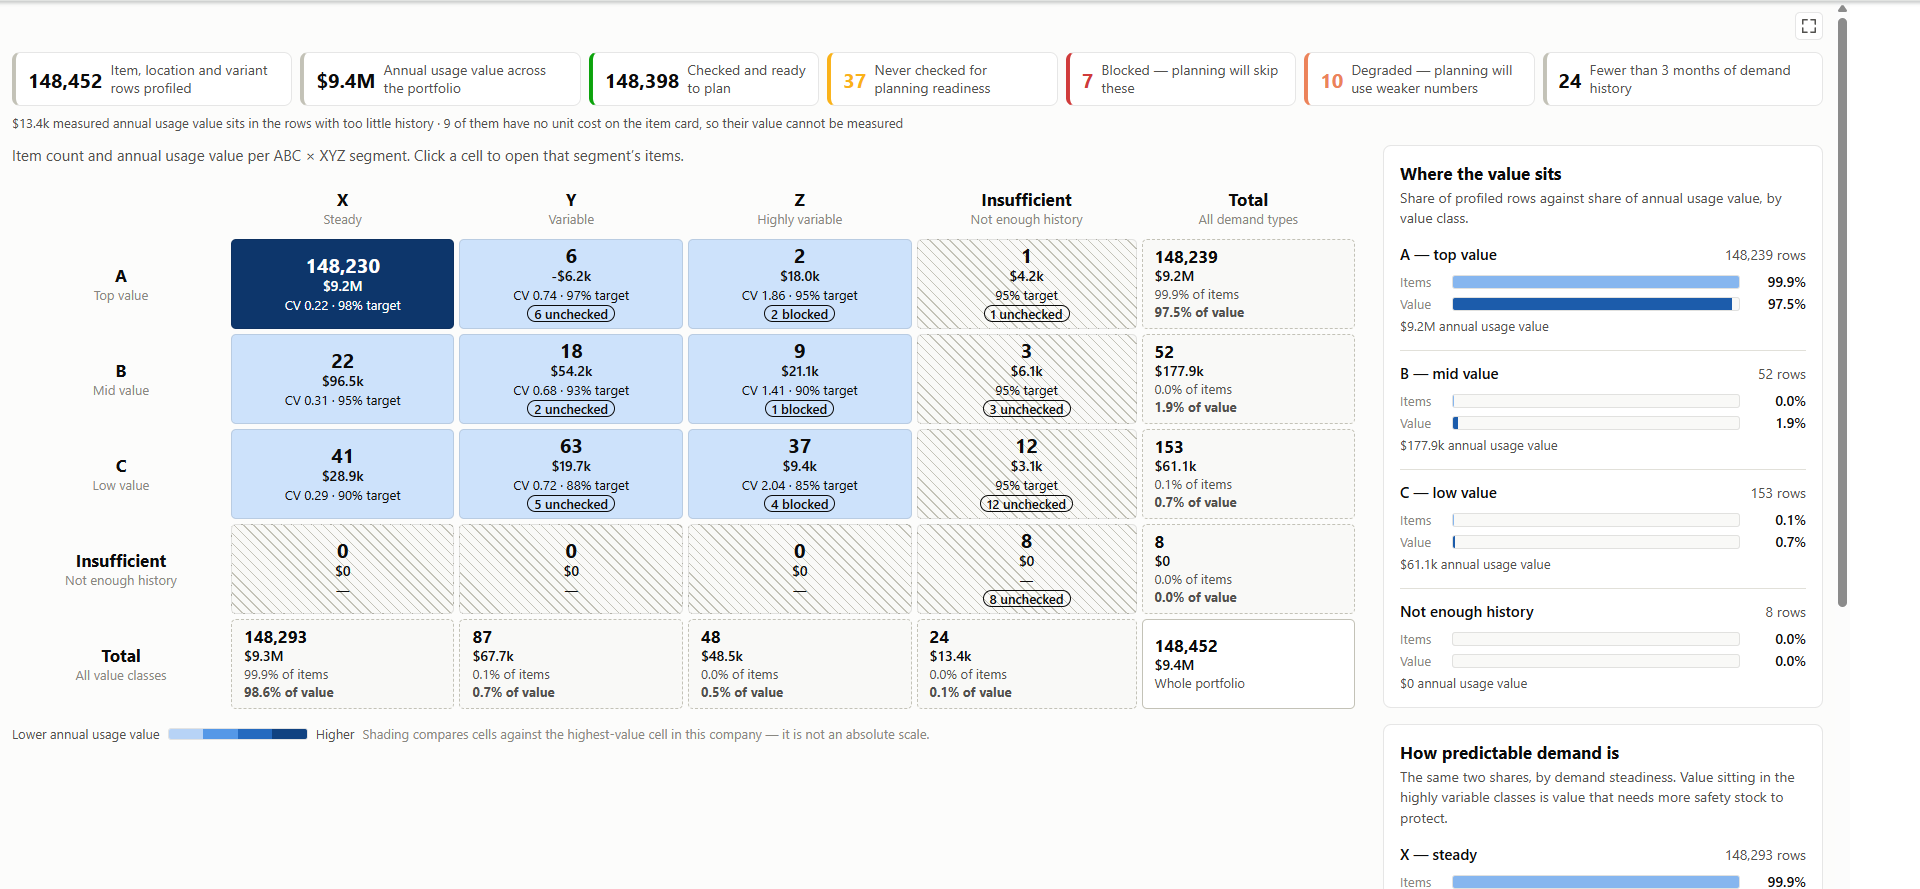
ABC × XYZ segmentation
A Pareto value class and a coefficient-of-variation volatility class, from the same demand history. An item with too little history is marked Insufficient Data — never quietly called predictable.
A panel of methods, one champion
Level, Trend, two Seasonal variants and two Intermittent variants, plus a Baseline. A rolling back-test picks the winner on weighted error — and the winner must beat the Baseline, or the Baseline ships instead.
Safety stock, reorder point, order quantity
An empirical lead-time-demand quantile as the primary method, a parametric formula as a cross-check, and lead time measured from your own posted receipts rather than assumed.
Approve, then write, then verify
Nothing reaches a native Business Central field without a human approving it first. Every write is confirmed by an independent second read before it counts as done.
The exception cockpit
Everything that needs a planner's attention, ranked by dollar exposure — so a handful of SKUs get named instead of a flat worksheet nobody reads top to bottom.
Native Business Central fields — the ones your planning run already reads
ForecastQ does not introduce a parallel set of planning fields. It computes values for the same fields Business Central has always had, and has always required a person to type in by hand.
| Native target | Fields written | Grain |
|---|---|---|
Stockkeeping Unit |
Safety Stock Quantity · Reorder Point · Reorder Quantity |
Item × Location × Variant — written wherever a stockkeeping unit exists at that scope. |
Item |
Same three fields | Company-wide fallback, used only when no stockkeeping unit exists to carry the value. |
Production Forecast Entry |
Forecast quantities, in base unit of measure, per period | Item × Location × Variant, honouring Business Central's own forecast-by-location and by-variant settings. |
Inventory Setup |
Current Demand Forecast |
The pointer that tells planning which forecast to consume — a separately confirmed action, never a side effect of publishing. |
One item, one location, numbers you can check by hand
An illustrative fastener at a single warehouse — not a customer result, but every figure below follows from the one before it, the way it would on your own data.
Twelve months of posted demand
Read directly from Item Ledger Entry. No staging, no watermark, no sync delay.
Classification decides how much attention this item earns
Twelve buckets is enough to classify honestly — three is the minimum ForecastQ requires before it will.
coefficient of variation = 9.39 ÷ 51.4 = 0.183 → class X, predictable
cell B×X → target service level 95%
Lead time, measured from your own receipts
Median and median-absolute-deviation, so one delayed shipment does not distort the whole policy.
Forecast: a panel of candidates, one honest winner
The champion is chosen on back-tested error — then must clear two honesty checks: it has to beat the Baseline, and its bias can't exceed 25% in either direction.
champion (Trend) error 10.6% bias +1.4%
next period 54 units
Safety stock and reorder point
Demand over the lead time has to be covered, and both demand and lead time vary — the combined deviation accounts for each, at the service level this item's class earns.
safety stock = 14 units
reorder point = 24.0 + 14 = 38 units
A person approves. Only then does Business Central change.
The recommendation sits as Proposed — service level, lead time and its source, and the winning method all visible — until someone approves or rejects it. The write itself is confirmed by a second independent read before it counts as done.
Where it actually earns its place next to what you already have
Business Central already includes a free, AI-powered forecast extension, and a capable planning tool for a single user costs nothing today. Both are real. Here is what neither one does.
Segmentation, plus a dollar-ranked exception list
ABC × XYZ classification combined with an exception list ranked by dollar exposure is not a feature we have found, shipped and visible inside Business Central, anywhere else in the category. A flat worksheet — or one chart per item — doesn't tell you which 40 SKUs out of 4,000 are this week's money.
You can see why the number is what it is
Named methods, not an unexplained score. Back-tested accuracy and bias visible per item. A floor that guarantees the result is never worse than a Baseline forecast. We have not found another product in the category that surfaces its own back-test accuracy to the person relying on it.
Computed together, not one at a time
A free, included forecast produces one blended, company-wide number per item by design — distributing it across warehouses is left to you. ForecastQ computes item × location × variant in the same run and writes to the stockkeeping unit that carries it.
Nothing leaves your tenant
No portal, no connector to keep alive, no second login, no copy of your ledger sitting somewhere else. If your goal is stable, low-maintenance technology, an extension that lives where your data already lives is the whole pitch.
What ForecastQ will never do
Not a shortfall — a boundary. Business Central's own engine already does these jobs correctly; ForecastQ's job is to feed it better numbers, not replace it.
| Capability | ForecastQ | Why |
|---|---|---|
| Netting demand against supply | Never | Business Central's Calculate Plan is correct, sophisticated and Microsoft-maintained. Rebuilding it doubles maintenance and guarantees the two disagree eventually. |
| Creating purchase orders | No | ForecastQ populates the fields the planning worksheet reads. Your existing approval flow stays exactly where it is. |
| AI anywhere in the forecast or policy numbers | By design | Determinism is the point. If narration is ever added, it will describe a computed row — never produce one. |
| A web portal or external connector | None, ever | Everything runs inside the tenant. No data egress, nothing to keep alive outside Business Central. |
Frequently asked, honestly answered
Doesn't Business Central already include AI forecasting for free?
Yes. Microsoft ships a free, Azure-AI-powered forecast extension with every Business Central subscription, and it's a reasonable tool for what it does. By design, it produces one blended, company-wide number per item — if you plan more than one location, distributing that number is left to you. It also doesn't touch safety stock, reorder point or reorder quantity; its output is a chart and a suggested order. ForecastQ forecasts item × location × variant simultaneously and writes the stocking policy the included extension never sets.
Isn't there already a product that writes those fields for free?
There is, for a single user, and it's a capable option. ForecastQ's argument was never that it's the only product able to write those fields — it's what it shows you about how it got there: named methods instead of an opaque score, back-tested accuracy and bias visible per item, a guarantee the result is never worse than a Baseline forecast, and lead time measured from your own posted receipts with the source stated in plain language.
What's the actual advantage, in one sentence?
ABC × XYZ segmentation combined with a dollar-ranked exception list — telling you which 40 SKUs out of 4,000 need attention this week — which we have not found, shipped and visible inside Business Central, anywhere else in the category.
Does ForecastQ create purchase orders or replace MRP?
No. Business Central's own Calculate Plan stays the only netting engine in your tenant. ForecastQ computes the inputs it has always expected a person to type by hand, then hands off entirely — your worksheet, your approvals, your purchase orders.
Is any of this AI?
No. The forecast, the safety stock, the reorder point — every figure is deterministic, reproducible arithmetic. Run it twice on the same ledger and you get the same answer, which is what makes it something a planner can check rather than something they have to trust.
Where does our data go?
Nowhere. Every computation runs inside your own Business Central tenant. There's no portal, no connector, and no copy of your ledger stored anywhere else.
See it run
Forty seconds: the back-test, the ranked exceptions, and the fields it writes into Business Central.
See it read your own ledger before it writes anything.
The Readiness Auditor runs read-only. Book a walkthrough and bring one warehouse — most tenants learn something about their own planning setup in the first few minutes.